How to Make Coronavirus Tracker in Python? Get current COVID-19 Cases
Due to Coronavirus, we all are at home and watching tv news to get a report of COVID-19 cases. Let’s make our own Coronavirus Tracker in Python. Let’s see how to make coronavirus tracker in Python.
Goal
So, we fetch the data from the internet and we printing data on the console as well as draw the graph of data. The program asks the user to choose what data they want. The first choice to get data of a specific country and second choice for Worldwide data of COVID-19 cases. Here we are using Covid module to fetch data and matplotlib for the graph.
Installation
You need two modules
pip install covid
pip install matplotlib
Coding
So, let’s track COVID-19 case of specific country. but before that import covid and make covid object of Covid() class
from covid import Covid
covid = Covid()
Covid module has a function named get_status_by_country_name(). This will give you following data.
>>> covid.get_status_by_country_name("italy")

{
'id': '11',
'country': 'Italy',
'confirmed': 225886,
'active': 66553,
'deaths': 32007,
'recovered': 127326,
'latitude': 41.8719,
'longitude': 12.5674,
'last_update': 1589880739000
}
But, we don’t need all data from this dictionary. We need only confirmed data, recovered data, active cases data, and death data.
So, we extract only those key from that dictionary using following code.
cadr = {
        key: data[key]
        for key in data.keys() & {"confirmed", "active", "deaths", "recovered"}
    }
So, we get following dictionary.
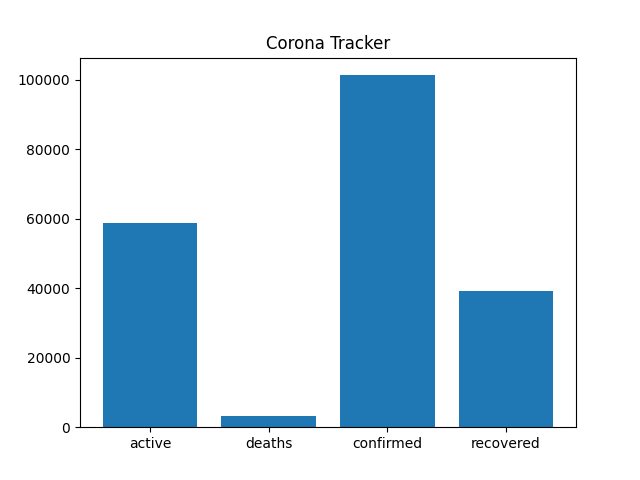
{'recovered': 39233, 'active': 58864, 'deaths': 3164, 'confirmed': 101261}
Now, store value and keys in another variable as list for graph.
v = list(cadr.values())
n = list(cadr.keys())
Okay, code for a specific country is over here. Let’s track the data of Worldwide case. Here we again get the same data (dictionary) as above but not for specific country.
Covid module has some inbuilt functions that are used to obtain total data of Covid-19 cases in the World. The following are the functions we use.
>>> covid.get_total_active_cases()
2705125
>>> covid.get_total_confirmed_cases()
4822430
>>> covid.get_total_recovered()
1798148
>>> covid.get_total_deaths()
318851
>>>
So now, we use this function to get data of total Worldwide COVID-19 cases. Here we define a dictionary variable to store data and to use in the graph.
cadr = {
        "confirmed": covid.get_total_confirmed_cases(),
        "active": covid.get_total_active_cases(),
        "deaths": covid.get_total_deaths(),
        "recovered": covid.get_total_recovered(),
    }
So, we get following dictionary.
{'confirmed': 4822430, 'active': 2705125, 'deaths': 318851, 'recovered': 1798148}
Now, store value and keys in another variable as a list for the graph.
v = list(cadr.values())
n = list(cadr.keys())
Now, done here, we wrote code for both choices here, for specific data and for worldwide data. Now, Only need to put in if-else cases but before that. To generate graphs. Import following module.
import matplotlib.pyplot as pyplot
and put this code at last
pyplot.title("Corona Tracker")
pyplot.bar(range(len(cadr)), v, tick_label=n)
pyplot.show()
Final Code
# Author: codesnail

from covid import Covid
import matplotlib.pyplot as pyplot

covid = Covid()
print("Want data of specific country (press: 1)")
print("World data (press: 2)")
ch = int(input("Enter your choice: "))

if ch == 1:
    country = input("Enter your country name: ")
    data = covid.get_status_by_country_name(country)
    cadr = {
        key: data[key]
        for key in data.keys() & {"confirmed", "active", "deaths", "recovered"}
    }

    n = list(cadr.keys())
    v = list(cadr.values())
elif ch == 2:
    cadr = {
        "confirmed": covid.get_total_confirmed_cases(),
        "active": covid.get_total_active_cases(),
        "deaths": covid.get_total_deaths(),
        "recovered": covid.get_total_recovered(),
    }

    v = list(cadr.values())
    n = list(cadr.keys())

print(cadr) # print data


pyplot.title("Corona Tracker")
pyplot.bar(range(len(cadr)), v, tick_label=n)
pyplot.show()
Output
Data in graph
Try this code and yes extend this code. You can also make your own COVID-19 tracker website.
Happy Coding :)
Also see: